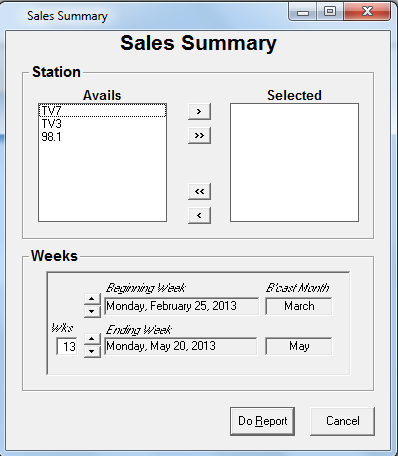
The summary by network report provides management with a chart stating the total booked, pending and declined proposals for each network (in Gross $) for the specified time period.
Steps for Generating Report:
•Select the desired networks to display in the report (Highlight the network name, then click on the single arrow icon (>). If all networks are to be selected, click on the double arrow icon (>>)
•Enter the desired flight parameters (start week and end week)
•Select Do report
•Once generated, the report will automatically appear in a preview window. The user is provided with the option to print or save the report being displayed
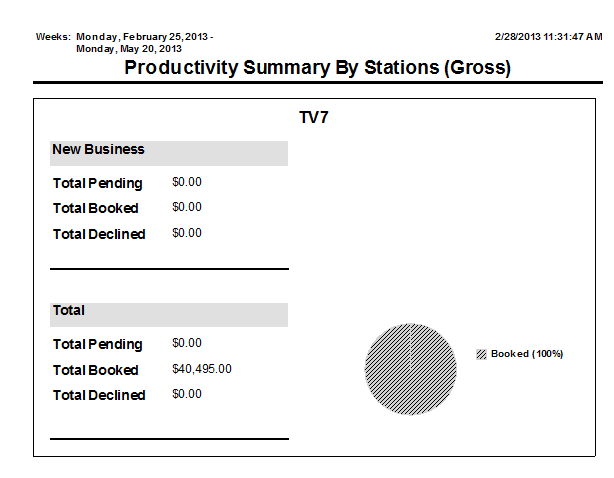
The Productivity Summary by Station Report provides management with an overall picture of sales activity for the specified time period. Total dollar amounts for new business are noted separately for Pending, Booked and Declined business. Each network has two pie graphs generated: Overall Business and New Business and displays the percent of the overall sum total. Users have the option of selecting multiple networks to run the report simultaneously or may select each network separately.